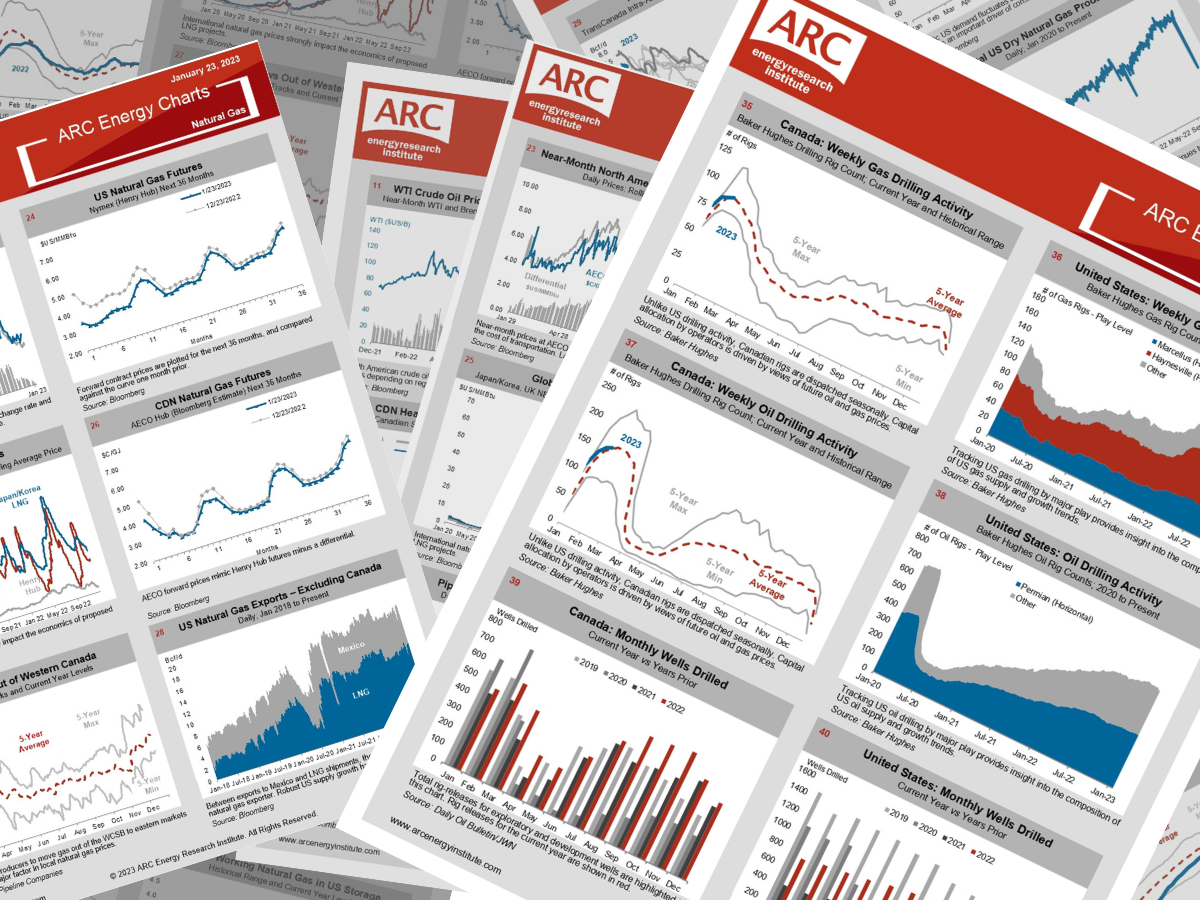
S&P/TSX E&P Index hits its highest since 2014; Natural gas futures remain in steep contango; US natural gas production down amid low prices

A weekly publication of charts illustrating oil and gas fundamentals
April 8, 2024 Charts
Written by wp_user | April 9th, 2024S&P/TSX Composite Index hits record high; WTI rallies as spot pricing surpasses US$85/b; Backwardation in WTI forward curve steepens M/M
April 1, 2024 Charts
Written by wp_user | April 2nd, 2024S&P/TSX E&P Index hits highest level since 2014; C5+ prices (as % of Edm Light) hit two-year low; Alberta oil production up 4% M/M in February
March 25, 2024 Charts
Written by wp_user | March 26th, 2024Clean energy indices continue to edge lower; Carbon credit futures reverse downward trend; WTI forward curve up significantly M/M
Contact Information
ARC Energy Research Institute
4300 – 400 3rd Ave S.W.
Calgary, AB
T2P 4H2
Direct Phone: (403) 292 – 0680
An Integral Part of ARC Financial Corp.
4300 – 400 3rd Ave S.W.
Calgary, AB
T2P 4H2
Direct Phone: (403) 292 – 0680
An Integral Part of ARC Financial Corp.
Join Our Newsletter
Stay Informed. Get the latest news and upcoming events from ARC Energy Research Institute delivered to your inbox weekly.
Recent Podcasts
 Oil and More Turmoil: An Interview with Raoul LeBlanc, S&P Global Commodity InsightsApril 16, 2024 - 4:23 pm
 EV Update and The Rise of HybridsApril 9, 2024 - 3:19 pm
 Carbon Spotlight: Demystifying Canadian Levies, Markets and BeyondApril 2, 2024 - 9:53 am

