SNAPCHART – LNG Breakeven Cost Comparisons
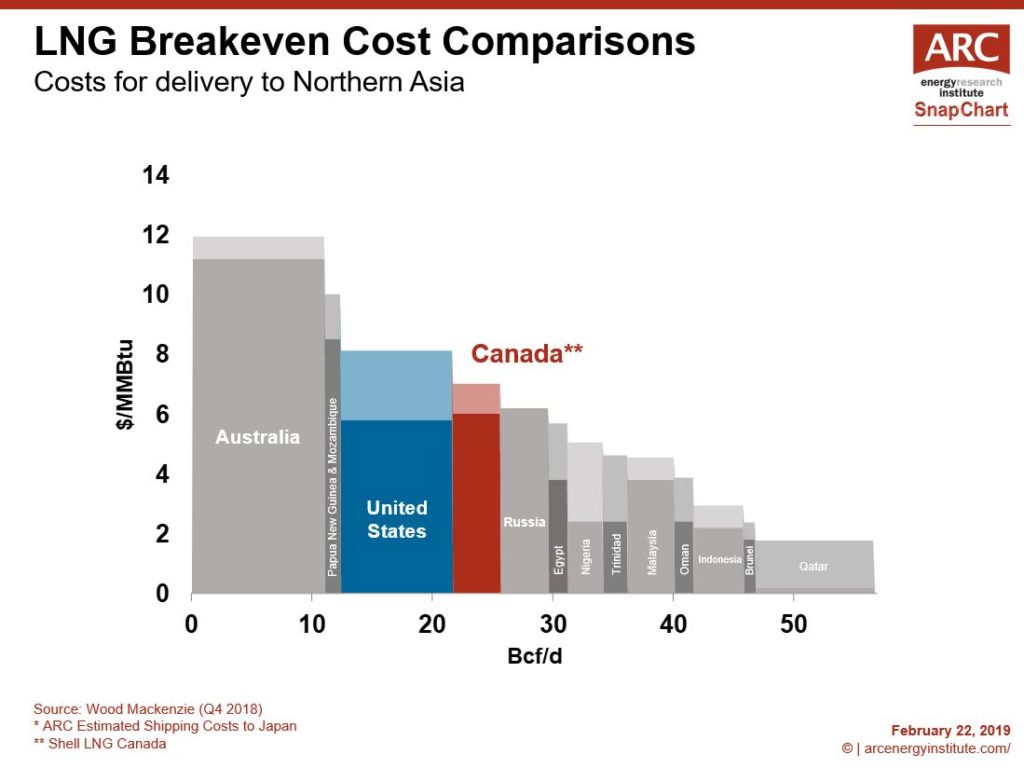
This week’s SnapChart plots the costs for delivering liquefied natural gas to growing Asian markets. For Canada, we show the delivered costs estimated by the LNG Canada project. The first major LNG project in the country, LNG Canada aims to deliver 1.8 Bcf/d of gas from British Columbia’s west coast to Asian markets by the mid 2020s. For the other countries, we use Wood Mackenzie’s estimate for production and liquefaction costs, along with ARC’s view of shipping fees.
The first observation is Canadian LNG can be delivered at a lower cost than Australia and the United States. This is significant, especially considering both Countries are emerging LNG powerhouses that have benefitted from large LNG investments over the last decade. Considering the projects in operation, under construction and under development, both Countries have capacities nearing 12 Bcf/d.
Another observation is that Canada is only slightly more expensive than countries like Russia and Egypt, and when you factor in the added benefit of energy security and proximity of supply that many others do not have, Canada’s competitiveness is very favorable.
Importantly, in an increasingly carbon-conscious world, Canada also offers GHG emissions intensity benefits. According to LNG Canada, their project will have at least 30 percent less emissions than US Gulf Coast projects and 50 percent lower than the average global LNG facility in operation today. Because of British Columbia’s GHG regulations – both on the LNG terminal and the upstream production – other potential West Coast Canadian projects will also have low greenhouse gas emissions compared to other places.
To learn more about Canadian LNG, hear our interview with LNG Canada’s Director of External Relations Susannah Pierce. The podcast is titled Canada’s Low Carbon LNG Opportunity.
