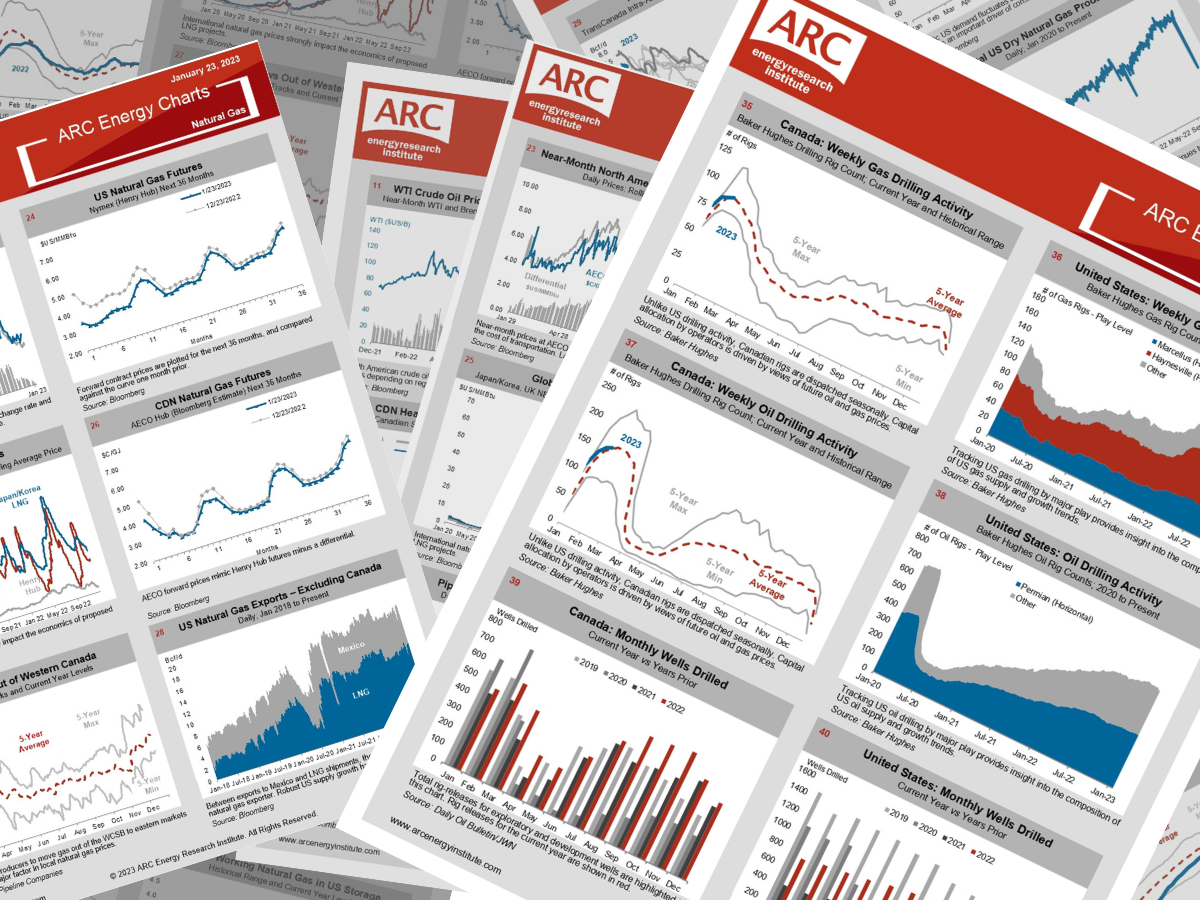
Prompt WTI dips below US$80/B; Front months of WTI curve flip to contango; US crude oil inventories on the rise

A weekly publication of charts illustrating oil and gas fundamentals
November 13, 2023 Charts
Written by wp_user | November 14th, 2023US crude oil stocks dip below the 5-year min; WCSB pipeline receipts back above 18 Bcf/d; Marcellus & Haynesville rig count down again
NOVEMBER 6, 2023 CHARTS
Written by wp_user | November 7th, 2023WTI forward curve jumps MoM; Prompt WCS differentials approaching US$30/B; AER releases Sep-2023 production data
OCTOBER 30, 2023 CHARTS
Written by wp_user | October 31st, 2023Clean energy indices continue to tick lower; WTI forward curve flattens month-over-month; Nat gas prices jump on bullish weekly storage #
Contact Information
ARC Energy Research Institute
4300 – 400 3rd Ave S.W.
Calgary, AB
T2P 4H2
Direct Phone: (403) 292 – 0680
An Integral Part of ARC Financial Corp.
4300 – 400 3rd Ave S.W.
Calgary, AB
T2P 4H2
Direct Phone: (403) 292 – 0680
An Integral Part of ARC Financial Corp.
Join Our Newsletter
Stay Informed. Get the latest news and upcoming events from ARC Energy Research Institute delivered to your inbox weekly.
Recent Podcasts
 ESG: Trends, Shifts, and ChangesApril 30, 2024 - 3:29 pm
 Unpacking Canada’s Budget 2024April 23, 2024 - 2:20 pm
 Oil and More Turmoil: An Interview with Raoul LeBlanc, S&P Global Commodity InsightsApril 16, 2024 - 4:23 pm

