SnapChart – Charting the Resurgence of OPEC Production
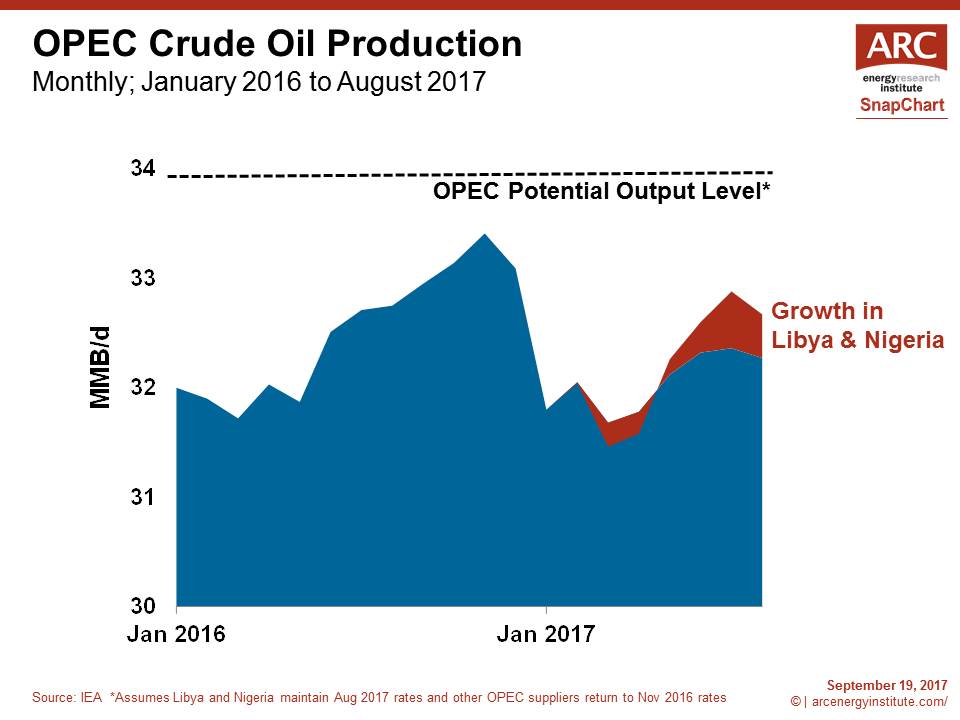
This week’s ARC SnapChart plots the comeback of OPEC’s crude oil production.
After hitting record high output last November at 33.4 MMB/d, OPEC and Russia agreed to production cuts. As a result, OPEC’s production dropped at the start of this year. However since then, the group’s output has been increasing.
 The biggest cause of the rebound has been increasing production from Libya and Nigeria; two countries that are not currently bound by the production cut agreement. From the start of this year, to August the two countries have collectively increased their production by 0.4 MMB/d.
Another problem with reducing production has been the continued high rates from Iraq and Iran, the second and third largest producers in the cartel respectively. Iran is producing slightly more oil than in November of last year, while Iraq’s output is down only 0.1 MMB/d.
Saudi Arabia has shouldered the majority of the cuts. The Kingdom’s production is down about 0.6 MMB/d compared to last November. For comparison, Russia’s output is down by 0.2 MMB/d.
Looking at these elevated OPEC production levels, you could conclude that the production cuts are not all that meaningful. However, this ignores the potential that, owing to higher output from Libya and Nigeria, OPEC can now produce at higher levels than their previous peak.
In a scenario where Saudi Arabia were to abandon its production cuts and return to its previous top rate, and other OPEC suppliers also pushed rates back up to November 2016 levels, then the groups production could grow by another 1.3 MMB/d. Add to this, Russia could potentially add another 0.2 MMB/d.
That is why, despite OPEC’s elevated production levels, the decision to extend the cuts into late next year is still consequential.

