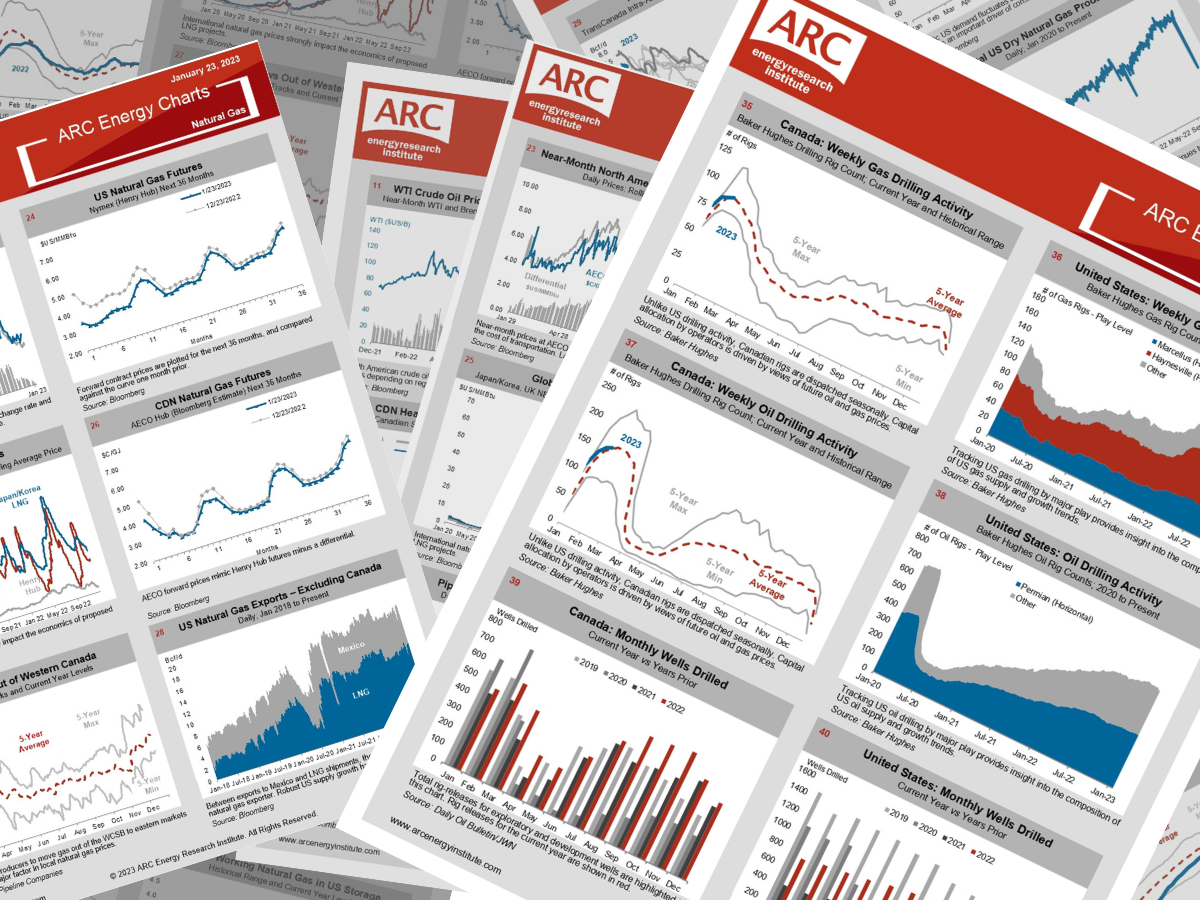
Clean energy indices continue to edge lower; Carbon credit futures reverse downward trend; WTI forward curve up significantly M/M

A weekly publication of charts illustrating oil and gas fundamentals
March 18, 2024 Charts
Written by ARC Energy Research Institute | March 19th, 2024S&P/TSX composite index creeps higher; Divergence b/w CDN vs US E&Ps widest since Jan-20; WCS differential at narrowest level since Aug-23
March 11, 2024 Charts
Written by wp_user | March 12th, 2024WTI forward curve unchanged M/M; NGL prices soften; Facility outages continue to impact US LNG exports
March 4, 2024 Charts
Written by ARC Energy Research Institute | March 5th, 2024S&P/TSX E&P Index up 7% W/W; Alberta oil sands production down ~350 MB/d M/M; US crude oil imports from Canada remain strong
Contact Information
ARC Energy Research Institute
4300 – 400 3rd Ave S.W.
Calgary, AB
T2P 4H2
Direct Phone: (403) 292 – 0680
An Integral Part of ARC Financial Corp.
4300 – 400 3rd Ave S.W.
Calgary, AB
T2P 4H2
Direct Phone: (403) 292 – 0680
An Integral Part of ARC Financial Corp.
Join Our Newsletter
Stay Informed. Get the latest news and upcoming events from ARC Energy Research Institute delivered to your inbox weekly.
Recent Podcasts
 Unpacking Canada’s Budget 2024April 23, 2024 - 2:20 pm
 Oil and More Turmoil: An Interview with Raoul LeBlanc, S&P Global Commodity InsightsApril 16, 2024 - 4:23 pm
 EV Update and The Rise of HybridsApril 9, 2024 - 3:19 pm

