
SNAPCHART – The Fiscal Pulse of Canada’s Upstream Oil & Gas Industry in 2020
ARC’s “Fiscal Pulse” model tracks trends in product volumes, prices, costs, money flows, profitability and capital efficiencies for the Canadian upstream oil and gas industry. This week’s SnapChart shows our estimates of the fiscal cycle for 2020. No surprise, the fiscal pulse has slowed because of low oil prices.
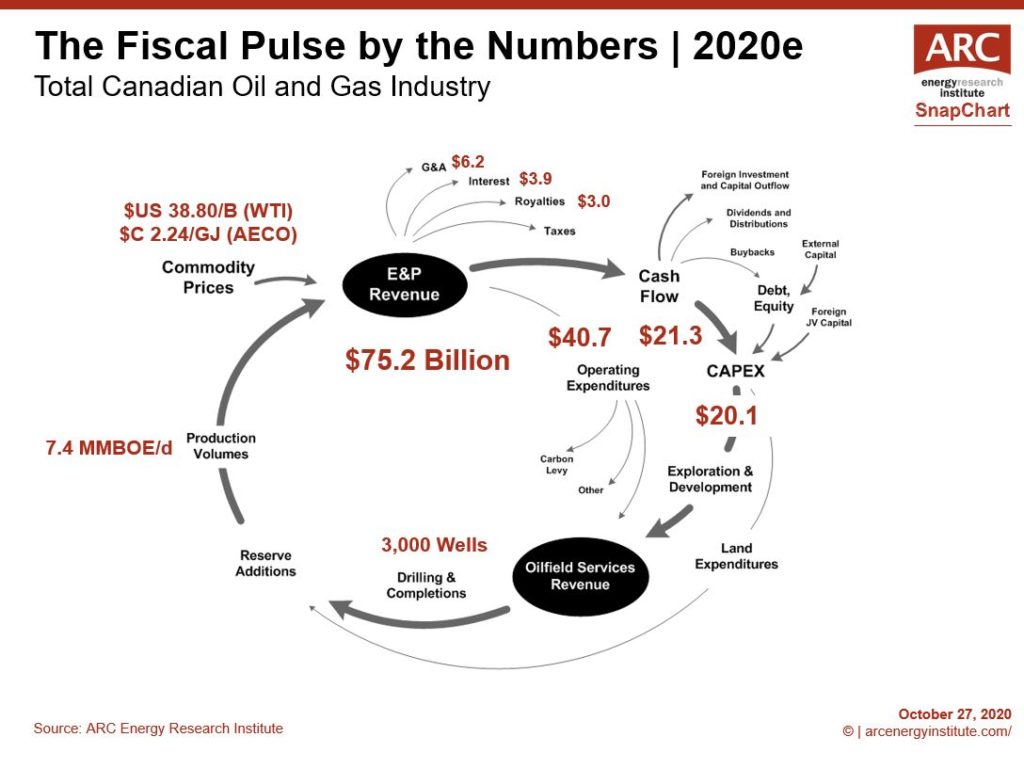
The Fiscal Pulse starts when oil and gas is produced and sold for revenue. We expect total industry revenues will reach over $C 75 billion, on track to decline 40% from last year.
Revenue is used to pay expenses, including general and administrative (G&A) costs, interest payments, royalties and taxes. Operating costs are the biggest expense and are estimated to total nearly $C 41 billion this year, not much different than last year.
After all the expenses are paid, the remaining money is called cash flow. Canadian industry cash flow is estimated at $C 21 billion this year, a long way down from the over $C 50 billion in 2019.
We expect the majority of cash flow generated by the industry will be reinvested into new capital expenditures (CAPEX) this year. Industry spending is expected to be $C 20 billion, nearly half of the previous year.
Over the last decade, all cash flow generated by the industry and more was reinvested into new CAPEX, but now shareholders are demanding companies shift priorities from investment to returning cash flow through share buybacks and dividends. Debt holders are also asking for more of their money back.
This pressure to return money to shareholders, along with the low commodity prices and liquidity issues, are catalysts for industry consolidation.
To learn more about the drivers for industry consolidation, listen to our podcast “Consolidation Gains Momentum in Canada’s Oil Patch.”
To learn more about the Fiscal Pulse of Canada’s upstream oil and gas industry, visit the last page of the ARC Energy Charts.

