
SnapChart – The Market Disconnect
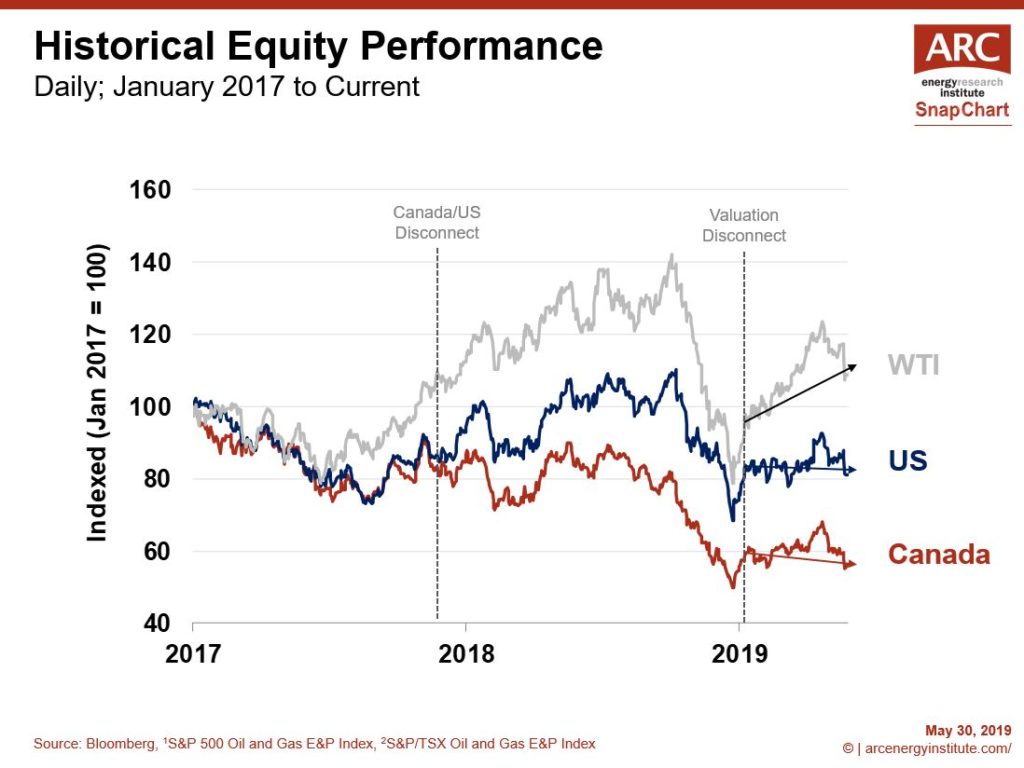
This week’s SnapChart plots equity indices of upstream oil and gas producers in the United States and Canada. Since the start of 2017, US equities are down 20 percent. Their counterparts in Canada are down 40 percent. Meanwhile, the broad US market (measured by the S&P 500) gained more than 20 percent.
There have been two distinct market disconnects over the past few years. The first one started in late 2017, when Canadian equities began discounting relative to their American peers. This timing corresponds to when the price discounts for Canadian oil started to widen because of growing oil sands supply and a lack of pipeline and crude-by-rail takeaway capacity.
The second disconnect occurred just before the New Year, after West Texas Intermediate (WTI) collapsed from $US 75/B in October to $US 42/B on Christmas Eve. Although WTI price has increased about 30 percent compared to the 2018 lows, the value of oil and gas equities have barely moved. Historically, such a large gain in oil price would have lifted the value of oil producers, but not this time.
Tune into our “Show me the Money” podcast and read our past commentary “Issues that are Weighing on Oil and Gas Investment” to find out more about oil and gas equity markets, the causes of the market disconnects, and what could turn things around.

