SnapChart – Canadian Pentane & Condensate Production Forecasts


The highly anticipated annual CAPP Crude Oil Outlook was published last week, with two notable changes compared to the previous edition: (1) the Eastern Canadian production outlook was boosted 100 MB/d because of the West White Rose Extension, and (2) for the second consecutive year, CAPP increased their outlook for pentane and condensates growth.

The prolific wet gas wells being developed on the northwest side of Alberta and over the border into northeast British Columbia are the cause of the upsized outlook for light liquids. Over the past few years, as a result of innovations in drilling and completion techniques, some Canadian gas wells are yielding oil at rates comparable to wells in Texas’ hyped-up Permian and Eagle Ford plays.

Considering  both the higher activity levels in the area and the potential for more technology upside, CAPP is likely to continue to make upward revisions to the outlook for Canadian light liquids.

June 20, 2017 Charts

June 20, 2017 Charts

The CAD has risen by $US 0.03 in recent weeks; WTI fell to its lowest since November 2016; US refinery utilization is well above typical

SnapChart – Oil Dependency Grows with Falling Price


Headlines around electric cars and carbon policy suggest our oil dependency is on a slippery downward slope. Recent data from 2016 suggests the opposite: our worldwide addiction is getting stronger.

Oil consumption versus economic activity (GDP) measures the energy “intensity” or “dependency” of our lifestyles to the wonder-fuel we love to hate. A steepening upward slope implies greater dependency and vice versa.

Before 2000 it took about 550 B/d to lubricate a change of $US 1 billion of global GDP growth. Higher oil prices from ’02 to ’13 lessened our dependency to 240 B/d through efficiency and substitution. Post the 2014 price crash we’re back up to guzzling 360 B/d for every extra billion dollars of petroleum-fuelled economy.

Gasoline demand is up, because people are driving more kilometers. And 50 million new petroleum vehicles (net of retirements) are hitting the road per year; over 30 million in Asia alone. Petrochemical demand is solidly correlated with economy.

Why are we surprised? When a product gets cheaper people use more.

SnapChart – BC Oil and Gas Capital Spending in Context

SnapChart – BC Oil and Gas Capital Spending in Context


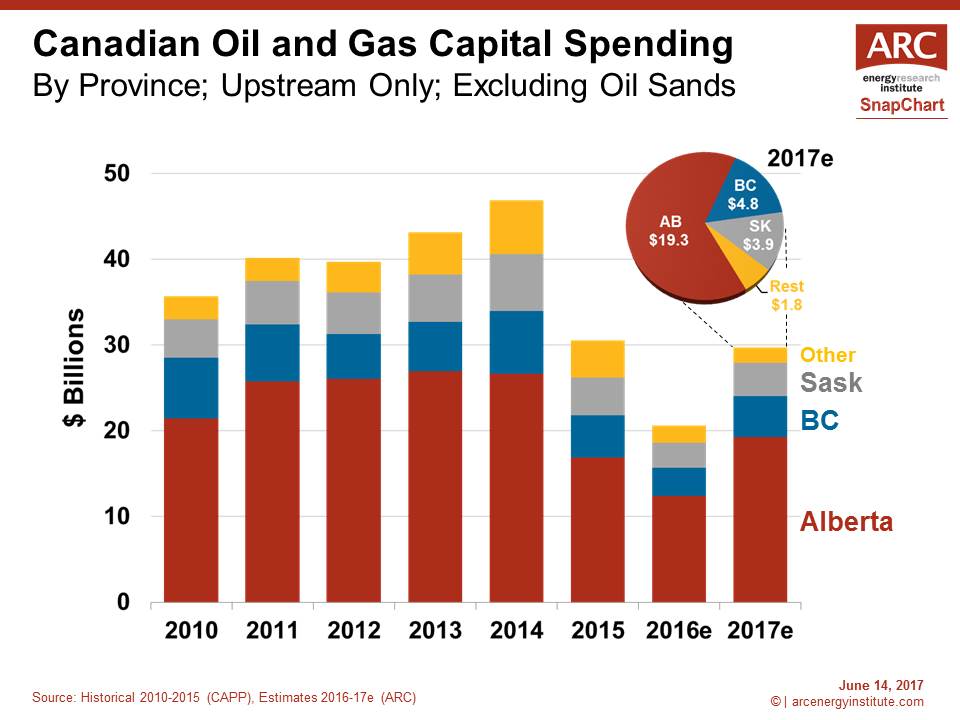
On June 8th, British Columbia elected its first minority government in 65 years. Whatever parliamentary arrangement emerges next week, the prognosis favours greater uncertainty for energy resource developers. And that could dampen capital spending in the province.

The oil and gas industry now spends about 15% of annual its upstream budget in BC, roughly $5 billion a year, mostly in and around Fort St. John and Dawson Creek.

Longer regulatory shadows on pipelines, hydraulic fracturing and LNG infrastructure have the potential to divert exploration and development to other jurisdictions like Alberta or the US.

The Site C hydroelectric dam project is also at risk. For comparison, Site C is expected to cost a one-time $8.8 billion, less than two years of upstream oil and gas spending.