Canadian rigs are going back to the field, coaxed by higher commodity prices and greater productivity. Across the land, 314 iron masts were turning bits last week, so the year-over-year rig count is up by almost 50%.
But where are they drilling?
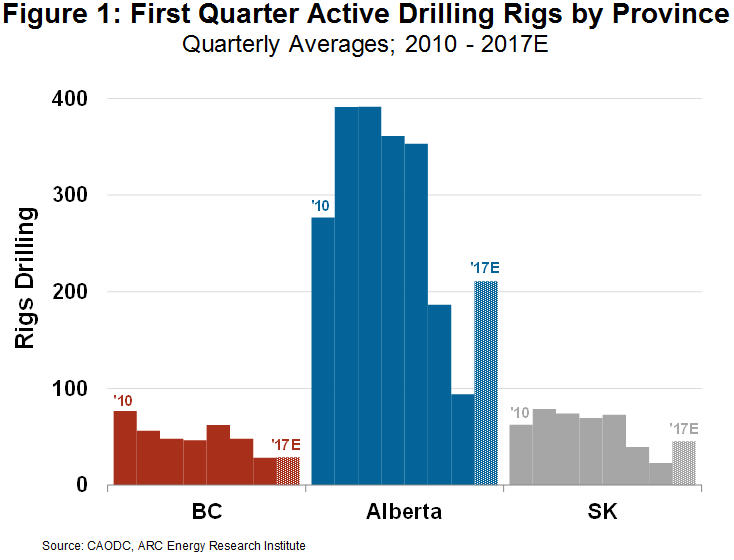
The pickup has been seen mainly in Alberta, somewhat in Saskatchewan and not so much in British Columbia (see Figure 1).
The Western Canadian Sedimentary Basin (WCSB) blankets an area twice the size of Texas and mostly underlays these three provinces. More like a rumpled blanket, the rocks underneath the WCSB hide all sorts of hydrocarbons, from natural gas, to condensates, to light oils through to the heaviest, most viscous energy commodities.
BC has mostly natural gas. Saskatchewan has mostly oil. Sandwiched in between, Alberta has a smorgasbord of everything, including the contentious oil sands, which is a separate category of resource development.
Depending on commodity prices, fiscal terms, regulations, technology, accessibility, infrastructure and many other factors, the emphasis of oil and gas development shifts geographically over time.
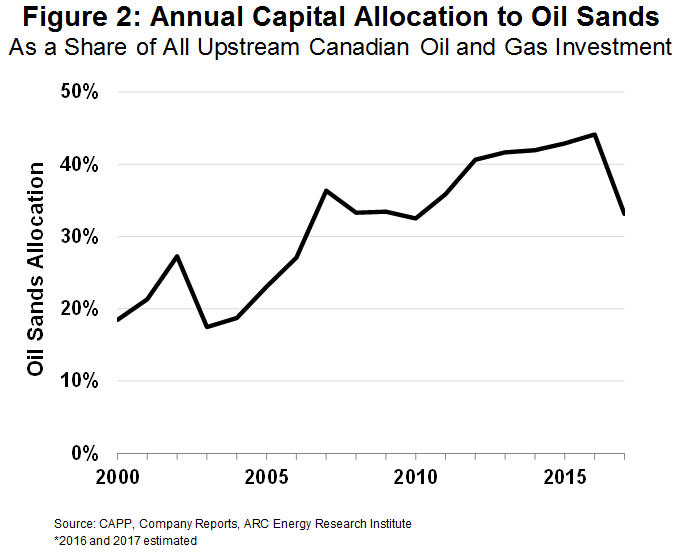
The first thing to note is that the spending bias in the Canadian oil and gas industry is tilting away from the oil sands after a 10 year uptrend (see Figure 2). For 2017, only one-third of the $42 billion in expected capital expenditures will be spent within the environs of Fort McMurray. It’s still a lot of money, but the spending bias is moderating after years of attracting elephant size investment (and whale size attention).
New investment dollars are leaning back toward natural gas, liquids and light oils in the traditional WCSB. Ground zero for renewed oil and gas activity is now in places like Fort St. John in BC; Grande Prairie in Alberta; and Estevan in Saskatchewan.
Why is Alberta getting the lion’s share of drilling activity, up over 200 rigs? The answer: Because like a lion the province’s resources have scale. Even after excluding the oil sands, over 44% of the WCSB’s remaining established reserves lay within its political borders.
And Alberta has the most diversity of hydrocarbon types too. So there are plenty of “source rocks” that can be tapped. Which rocks to choose at any one time depends upon the prevailing factors mentioned earlier. Right now the west central and northwest parts of the province are showing tremendous productivity improvements with new drilling and completion processes (see last week’s blog). Technology and innovation do amazing things for the entrepreneurial mind (so does a prolonged price crash). All of sudden much can be developed at $US 50/B or better.
Saskatchewan has easy-to-access, light oils that are relatively shallow. It also has the lightest royalty burden of the three jurisdictions. But the prairie province lacks Alberta’s scale and there is a limit to the amount of annual spending it can absorb. Nevertheless, on a percentage basis there are twice as many rigs working so far in this first quarter as compared to the first quarter of last year and process improvements are likely to drive the count higher yet.
Northeast British Columbia is rich in natural gas and the productivity numbers for bringing it out of the ground suggest that some of the rocks are better than any in North America. Above ground, continental gas prices are better than last year. So why is the rig count no better in BC than last year?
In some ways, BC’s story is too good. Localized natural gas prices are prone to big discounts due to constrained takeaway capacity in full-up pipelines. While oil gets the headlines, BC’s natural gas currently shoulders the real “market access” problem.
But there is another story brewing in BC. Recently, high-productivity light oils are starting to turn heads in select areas around Fort St. John. Although the rig count isn’t showing much improvement over last year at this time, don’t count out BC yet – the province may shed its reticence to oil once they realize they may actually have quite a bit.
Finally, rig count is a misleading metric when it comes to production growth. Modern rigs drilling on multi-well “pads” are twice as productive today, drilling longer wells, compared to only a couple of years ago. So today’s 100 rigs working is like at least 200 in 2014.
Yes, Canada’s oil and gas industry is rebounding. But it’s not just a business-as-usual rebound. This one rebound has many positive aspects for all three provinces.
Make sure to join us at our event on April 3rd, “The Battle for the Hearts and Wheels of the Market,” in Calgary, Alberta. For more information visit: https://www.arcenergyinstitute.com/section/events/